


Scientists are developing ways to probe the activity, function and organization of neurons in real time with increasing precision.

Life is full of nervous reactions — a head snaps towards a voice, leg muscles tense at the sound of a starting gun and thirsty mice scamper towards a squirt of water when trained to respond to a certain tone.
The mechanisms behind such reward-related behaviours are notoriously difficult to unpick. Nerve cells often snake through multiple brain areas, and their long axons and dense, tree-like dendrites can spark cellular conversations with thousands upon thousands of neighbours. Neural filaments can be exceptionally fine, and their positioning is crucial: disruptions in neural networks can lead to a range of neurological conditions. Yet, “If you want to label more than a few neurons at the same time and then trace where their axons go, it’s really difficult”, says Xiaoyin Chen, a neuroscientist at the Allen Institute for Brain Science in Seattle, Washington.
Still, researchers are slowly creating the tools to untangle that complexity, harnessing the power of sequencing, optogenetics and protein engineering to trace neuronal connections, record their activity, measure their inputs and outputs and map their networks.
The conventional way to label cells is to tag them with fluorescent dyes and then look at them under the microscope. But this technique can typically track only a few handfuls of cells, so Anthony Zador and his co-workers at Cold Spring Harbor Laboratory in New York developed a tool to trace thousands of individual neurons in parallel. Rather than dyes, they used viruses to insert a unique RNA sequence, or barcode, into each neuron. They could then map how the neurons connected with each another by taking samples from regions close to where the virus was injected, grinding them up and extracting the RNA, then sequencing it to look for the barcodes.
The technique, known as multiplexed analysis of projections by sequencing (MAPseq), was published in 20161, and was widely regarded as a technological breakthrough for high-throughput mapping of neural connectivity, Chen says. But the method could indicate only roughly where the axons were going, like providing county-level detail, rather than a street address. And Chen, who had recently joined Zador’s laboratory as a postdoctoral researcher, wanted more detail. For example, Chen says, MAPseq could tell him that the neurons he was studying were in the auditory cortex, but not which of the region’s six layers they were in.
So Chen made a key modification to the technique. Rather than sequencing barcodes from ground-up brain slices, he sequenced them directly in fixed tissue, thereby retaining spatial information. “You still get the same projection patterns, but in this case you can see where the cells are,” Chen says.
Called BARseq (barcoded anatomy resolved by sequencing)2, the method helps researchers to correlate projection patterns with other properties, such as expression of specific genes. Chen and his colleagues, for example, combined it with a method known as fluorescence in situ hybridization (FISH) as well as targeted protein labelling, to identify different types of neuron.
Imaging update
Earlier this year, Chen and his colleagues took the technique a step further, adding in the ability to profile gene expression throughout the genome3. They then used BARseq2 to map the expression of 20 proteins known as cadherins, which help to guide the development of neuronal projections, and found that similar types of projection express similar sets of cadherins even when they originate in different areas of the brain. “The fact that we find the same signature in two cortical areas supports that we found something that may reflect general organization of the cortex, and not just peculiarity in certain cortical areas or artefacts in the data,” says Chen. Applying BARseq2 earlier in development could also give insight into how these molecules “are actually directing the establishment of these projections”, he adds.
The ability to correlate spatial mapping with gene expression means that scientists can now start to tackle a long-standing question: do groups of neurons that share a molecular profile have similar connectivity? In other words, “can you use gene-expression patterns to predict where the cells would project to?” says Allen Institute director Hongkui Zeng.
Other researchers are using barcoded viruses to answer different questions. Researchers led by neuroimmunologist Francisco Quintana at Harvard Medical School in Boston, Massachusetts, for instance, developed a method called RABID-seq (rabies barcode interaction detection followed by sequencing) to investigate mechanisms of cell–cell interaction in vivo4. The technique uses a virus that is engineered to infect only cells of interest and express a barcode as it spreads from cell to cell. That helps researchers to identify which cells are interacting and then to identify molecular pathways that might mediate those interactions. They also engineered the virus to express the red fluorescent protein mCherry so that they could isolate infected cells in a cell sorter and investigate the mechanisms involved in follow-up experiments. “You can go all the way from ‘which cells interact’ to ‘what mechanisms’ and potential targets,” says Quintana.
At the Allen Institute, Zeng and her colleagues have created ‘enhancer viruses’ to drive expression of target genes in specific cell types5,6. The researchers used single-cell RNA sequencing and a technique known as single-cell ATAC-seq to identify stretches of DNA that are accessible to the proteins that regulate gene transcription. They could then insert the relevant regulatory regions into viruses to drive expression of specific genes in specific cell types — in brain slices and even in other species, Zeng says, including tissues that are not typically amenable to genetic methods.
Neuroscientist Rui Costa at Columbia University in New York City plans to use enhancer viruses to tease out the roles of mouse neurons that respond to the neurotransmitter dopamine in learning, reward and movement, as well as to investigate different susceptibilities to degeneration. Such ‘dopaminergic’ neurons are lost in conditions such as Parkinson’s disease.
Light work
Other scientists are developing innovative ways to probe neuronal activity using optogenetics — techniques that use light to control cells.
Typically, researchers use an enzyme known as Cre recombinase to turn genes on or off in specific cell types or in response to genetic or chemical cues. In 2016, two independent research teams put Cre under the control of light. The approach, in both cases, was to split the enzyme into two pieces that would become active only when reassembled in blue light7,8. However, that meant that tissues needed to be injected with two separate engineered genes, and those genes needed to be expressed at comparable levels for the technique to work. “If you could control Cre with a single-chain protein, then you could potentially be more efficient and rapid,” says Gaël Yvert, a molecular geneticist at the École Normale Supérieure de Lyon in France.
To create a more powerful system, Yvert’s team pored over the crystal structure of Cre, looking for pieces of the enzyme that they might be able to make use of to control the protein with light. They were looking for things that they “could unblock or play on to have a switch”, Yvert says. They identified several helices that were crucial to the enzyme’s activity and fused a light-responsive domain from oat plants into these positions. The result was LiCre: an enzyme that can be activated within minutes and reach a much greater intensity than previous systems9.
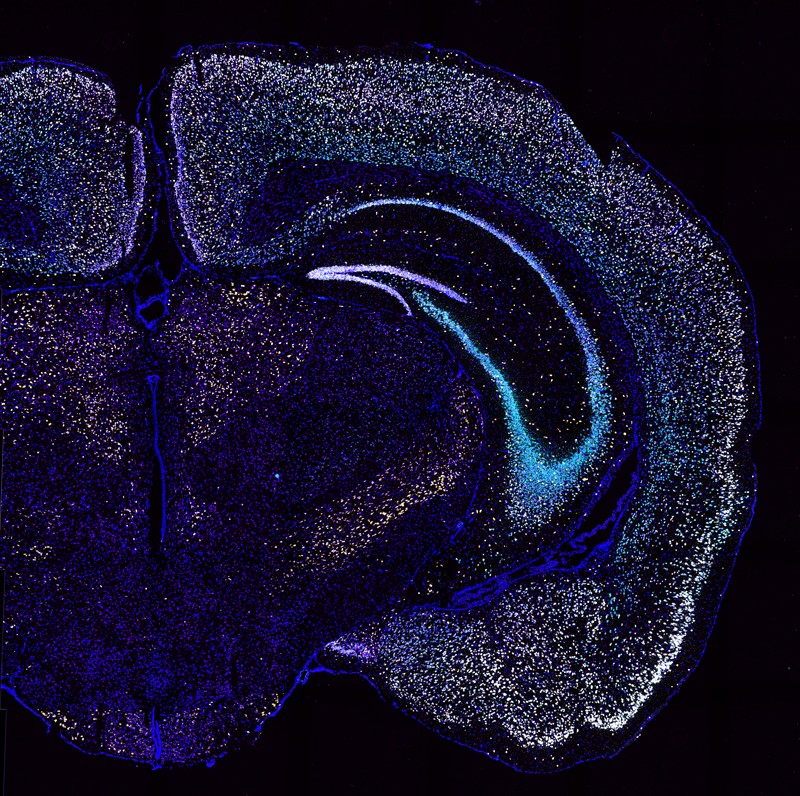
Gene expression in a slice of mouse brain, captured with BARseq2.Credit: Yu-Chi Sun et al./Nature Neurosci.
Steven Wyler, a postdoctoral researcher at the University of Texas Southwestern Medical Center in Dallas, wants to use LiCre to investigate groups of neuronal cell bodies called ganglia to understand more about how information from various tissues helps the brain to stay metabolically stable. But ganglia are delicate structures that are easily damaged. “LiCre would hopefully allow us to have both spatial and temporal control of Cre activity without causing physical damage to the neurons,” says Wyler.
Researchers have also created sensors that measure the calcium dynamics inside living cells. Calcium levels are crucial to biological decisions — they can determine when a muscle cell contracts or initiates programmed cell death (apoptosis), for instance — so quantifying them accurately helps scientists to model cell behaviour. Most of the existing tools can determine whether calcium levels are rising or falling, “but it’s close to impossible to quantify the actual concentrations”, says Joachim Goedhart, a cell biologist at the University of Amsterdam.
These techniques generally use proteins that fluoresce in the presence of calcium, but the level of fluorescence can also be affected by experimental conditions such as pH, how much of the probe is present or the thickness of the sample. A way to get around such complications is to use fluorescence lifetime — how long the fluorophores spend in the excited state after absorbing a photon — instead of intensity.
To harness this property, Goedhart and his colleagues modified the structure of a turquoise fluorescent protein to optimize its lifetime and brightness, and added a calcium-sensitive protein domain10. The result was a probe that could provide robust measurements of the calcium levels in both individual cells and multicellular tissue.
Helmut Kessels, a neuroscientist at the University of Amsterdam, and his co-workers plan to use the probe in slices of mouse brain to test whether intracellular calcium levels drop with age or as cells and tissues start to show characteristics of Alzheimer’s disease. He’s particularly keen to get a measurement that doesn’t vary with the thickness of the sample. “Since its signal is measured using lifetime imaging, this should be independent of tissue depth,” he says.
One potential constraint on the use of such fluorescent markers is the speed of many microscopes. At present, Goedhart’s microscopy system cannot take measurements faster than once every 1.6 seconds, which could limit some applications in neuroscience, given that fluctuations in calcium levels correlate with a neuronal firing rate of around 200 per second. But faster microscopes do exist: some labs have built there own, and commercial versions are available through suppliers such as Leica Microsystems in Wetzlar, Germany, and Picoquant in Berlin.
Converging signals
There’s another, broader, limitation, too. Calcium indicators allow researchers only to “read out the neural activity in real time”, says Christina Kim, a neuroscientist who started her lab at the University of California, Davis, last month. That’s a problem, Kim says, because if you want to manipulate neurons or delve into their molecular make-up, you need to be able to identify which neurons are relevant for a particular behaviour.
When she was in Alice Ting’s chemical-biology lab at Stanford University in California, Kim and fellow postdoc Mateo Sanchez developed a method that can do just that.
The tool builds on an earlier technique created in Ting’s lab, called fast light- and activity-regulated expression, or FLARE. Like many genetically encoded sensors, FLARE combines calcium and light sensing to identify groups of neurons that are active during a defined time window. But it goes a step further: on detecting elevated calcium concentrations and the presence of blue light, it causes one of the proteins in the membrane to move into the nucleus and start driving transcription of a fluorescent reporter protein11. This provides a lasting record of which cells were active and allows those same cells to be subsequently analysed for other properties.
But, Ting says, FLARE has “considerable background leak”, giving a signal even in the absence of light and calcium. And because neurons need to be exposed to it for at least ten minutes, it is too slow to apply to fast behaviours in vivo, says Ting.
Kim and Sanchez made two key improvements. First, they made the signal stronger by using a more efficient enzyme to control the translocation of the transcription factor. Second, they optimized the light-sensing molecule to further reduce the amount of leak.
The improved tool, called fast light- and calcium-regulated expression, or FLiCRE, can label neurons that are activated for as little as one minute. In a paper12 published last December, Kim and her colleagues used the method in mice to tag and identify cells that help regulate aversive behaviours, such as avoidance of an electric shock or unpleasant odour, then stimulate the relevant neurons without actually subjecting the mice to unpleasant stimuli.
Deeper understanding
Still, as much as calcium levels and other cellular properties can reveal about neural circuitry, some of the deepest questions in neuroscience demand other methods. “Calcium imaging tells you which neuron fires during a particular task, but it doesn’t tell you why it fires,” says Kaspar Podgorski, a neuroscientist at the Howard Hughes Medical Institute’s Janelia Research Campus in Ashburn, Virginia. Understanding what makes a given neuron fire requires measuring the inputs going into that cell.
A suite of sensors is now helping researchers to measure these inputs. The dLight113 and GRABDA14 sensors, for instance, detect changes in dopamine. The GACh family of sensors monitor transmission of acetylcholine, a key neurotransmitter involved in dilating blood vessels and slowing heart rate15. And red-shifted dopamine sensors (RdLight1)16 can be combined with green fluorescent protein-based sensors to provide scientists a more nuanced view of neuronal systems.
Neuronal communication, Podgorski says, is fascinating. “Neurons receive thousands of inputs. They’re just bombarded.” Somehow, the cells parse all those signals to meaningful effect, translating them into an appropriate action. “Neural computation is the question: How does information flow through the network? How do inputs get transformed into outputs? And where does the activity go? I think we’re really at the cusp of being able to very richly study neural computation,” he says.
Nature 599, 335-337 (2021)
doi: https://doi.org/10.1038/d41586-021-03054-9
References
- 1.
Kebschull, J. M. et al. Neuron 91, 975–987 (2016).
- 2.
Chen, X. et al. Cell 179, 772–786 (2019).
- 3.
Sun, Y.-C. et al. Nature Neurosci. 24, 873–885 (2021).
- 4.
Clark, I. C. et al. Science 372, eabf1230 (2021).
- 5.
Graybuck, L. T. et al. Neuron 109, 1449–1464 (2021).
- 6.
Mich, J. K. et al. Cell Rep. 34, 108754 (2021).
- 7.
Taslimi, A. et al. Nature Chem. Biol. 12, 425–430 (2016).
- 8.
Kawano, F., Okazaki, R., Yazawa, M. & Sato, M. Nature Chem. Biol. 12, 1059–1064 (2016).
- 9.
Duplus-Bottin, H. et al. eLife 10, e61268 (2021).
- 10.
van der Linden, F. H. et al. Preprint at bioRxiv https://doi.org/10.1101/2021.06.21.449214 (2021).
- 11.
Wang, W. et al. Nature Biotechnol. 35, 864–871 (2017).
- 12.
Kim, C. K. et al. Cell 183, 2003–2019 (2020).
- 13.
Patriarchi, T. et al. Science 360, eaat4422 (2018).
- 14.
Sun, F. et al. Cell 174, 481–496 (2018).
- 15.
Jing, M. et al. Nature Biotechnol. 36, 726–737 (2018).
- 16.
Patriarchi, T. et al. Nature Methods 17, 1147–1155 (2020).
(Sources: Nature)

Đăng nhận xét